
Performance
The recorded frame time and allocation figures from the Horde Survival benchmark, with the method, the machine, and the date they were measured.
On this page
Competitors sell scale with adjectives. Here are the numbers from a run you can repeat, with the machine and the date attached.
The problem
Section titled “The problem”“Will it hold up with a thousand enemies?” is the question every graph tool gets, and the honest answer depends on the graph, the machine, and the rest of the game. Horde Survival exists to give that question one measured answer: every enemy decides through EnemyBrain.bqbehavior and one director entity runs HordeDirector.bqbehavior, with a benchmark scene that drives itself and records its own frame times.
See it
Section titled “See it”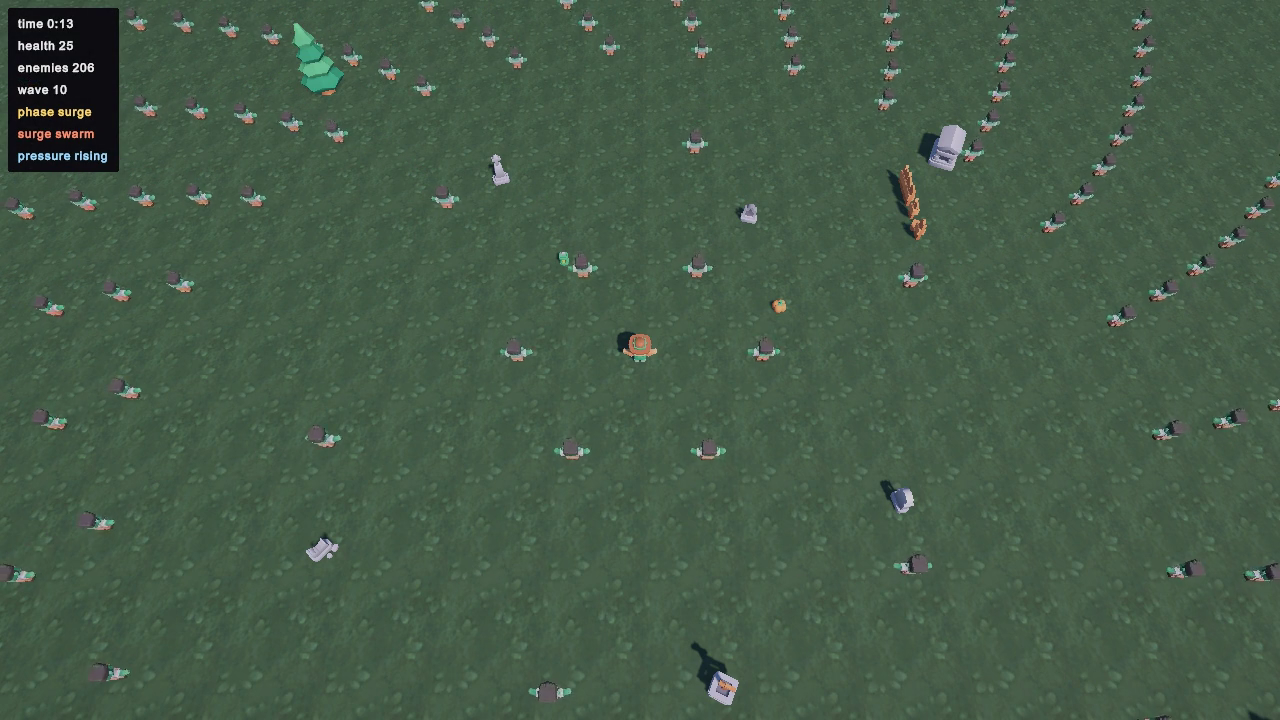
The recorded figures
Section titled “The recorded figures”Measured 2026-08-04, after the surge population threshold became a graph value, so the director carries one extra declared slot and reads it every tick.
| Metric | Value | Bound |
|---|---|---|
| mean frame time | 12.03 ms | <= 16.7 ms |
| p99 frame time | 15.69 ms | <= 16.7 ms |
| max frame time | 22.34 ms, informational | none |
| frames sampled | 4,989 over 60.007 s | >= 60 s |
| minimum live enemies | 2,400 | >= 2,000 |
| managed bytes allocated on measured thread | 0 | 0 |
| max managed bytes in any measured frame | 0 | 0 |
| generation-zero collections | 0 | 0 |
| director graph instances | 1 | 1 |
An earlier run of the same scene on 2026-07-31, before that threshold moved into the graph, recorded 9.07 ms mean and 11.63 ms p99 over 6,614 frames in 60.006 s, with the same 2,400 live enemies and the same zero managed bytes.
The method
Section titled “The method”- A release, non-development Windows x86-64 IL2CPP player with Burst AOT, built from the checked-in
HordeBenchmarkbuild profile. - 1920x1080 fullscreen, vertical sync off, frame rate uncapped, all three applied at startup by the scene’s own bootstrap.
- Hands off. The survivor drives itself along a fixed pattern, survivor death is disabled, and the wave schedule holds the live count at the 2,400 ceiling.
- The recorder waits until at least 2,400 live enemies have held for the warmup, then samples its own unscaled frame delta and the current thread’s managed allocation counter at the same point every frame for 60 seconds, and writes
benchmark-report.json. - No profiler, no debugger, and no connected automation call participated in the sampling window, and the machine was otherwise idle.
Machine class, recorded with the 2026-07-31 Windows scale evidence: a Windows 11 Pro desktop with an Intel Core Ultra 7 265F (20 cores), 31.7 GiB of RAM, and an NVIDIA GeForce RTX 4060 Ti, on Unity 6000.7.0a3.
Why these are player numbers
Section titled “Why these are player numbers”The pass metric is a release standalone run because an in-editor run measures the editor as well as the game. In-editor numbers from the same scene are recorded in the project’s own notes as a working observation and are treated as unpublishable results, which is why none of them appear above.
Zero managed bytes on the measured thread is the allocation claim, measured directly on the thread that runs the simulation and presentation callbacks. Burst jobs cannot allocate managed memory, and the window opens with a forced collection so the counter starts clean. Collection count is recorded separately, because a collection triggered on another managed thread would not change the measured total.
Run it yourself
Section titled “Run it yourself”The benchmark scene carries no HUD of its own. The live enemy count on screen belongs to the gameplay scene, HordeSurvival.unity, and the benchmark reports through its own summary and benchmark-report.json instead.
What the figures do and do not cover
Section titled “What the figures do and do not cover”- They cover this graph, on this scene, on this machine. Your graph’s breadth, your binders, your command handlers, and your rendering are your own budget.
- They cover the entity host. A GameObject scene with 2,400 agents is a different measurement, and one nobody here has published.
- They cover steady state at scale. Bake and initialization allocate, which is what makes a warmed tick free of managed allocation.
Profile your own game before changing your graphs for speed. The Burst and jobs page names what is compiled and where your code sits relative to the job, which is where the profiler’s answer usually points.
When it goes wrong
| Symptom | Check | Fix |
|---|---|---|
| Your own scene misses the frame budget at a fraction of this count. | Profile with the graph tick disabled to separate the decision from the rest of the frame. | Whatever the profiler names first. Rendering and physics at scale usually cost more than the decision. |
| Managed allocation appears every frame. | Look at your binder and your command handlers, then the runtime. | Keep temporary containers and string building out of the per-frame path. |
| The benchmark scene runs slowly in the editor. | Confirm whether you are reading an editor run or a player run. | Build the release profile for any number you intend to quote. |
| The recorder never writes a report. | Read whether the live enemy count reached the configured hold. | Let the wave schedule reach scale before expecting the sampling window to open. |
- Horde Survival sample: the game these figures come from.
- Burst and jobs: what runs where.
- Entity agents: the host that carries the swarm.